
The AFS Dashboard provides a standardized list of financial statement analytics to compare over time.
The AFS Dashboard is the third "tab" in the Analytics Page of DiligenceHub.
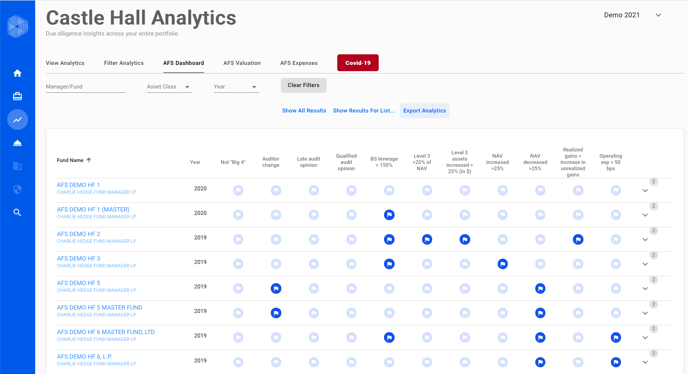
The AFS Dashboard presents a standardized list of analytical factors to assess across your portfolio. The factors include:
- Not big 4 auditor
- Auditor change
- Late audit opinion
- Qualified audit opinion
- Balance sheet leverage > 150%
- Level 3 assets > 25% of NAV
- Level 3 assets increased > 25% (in $)
- NAV increased > 25%
- NAV decreased > 25%
- Realized gains < increase in unrealized gains
- Operating expenses > 50 bps
To access the AFS Dashboard follow these steps:
- Select the Analytics page from the menu down the left side of your DiligenceHub app by clicking on the "lightning bolt" icon
- Click on the AFS Dashboard "tab"
- Choose to "View All Results" or "Show Results for List"
- Scroll down and across to review the funds which have had the analytics factors triggered
- Click on the drop down arrow on the far right of any fund to view the flags from prior years
- Search for specific managers or funds, or filter the results by Asset Class or Year
- Export the results if desired
We recommend that our clients complete financial statement reviews across all reporting funds in their portfolio to ensure complete risk analysis.
Please contact our Client Support team to learn more about our Financial Statement Analysis services.
We hope the DiligenceHub Help Center will provide quick answers to your questions as you as you begin to use the app. Please browse the articles at your convenience - and, of course, feel free to send a support ticket or live chat with our team if you have questions at any time.