
.png?width=200&height=78&name=CH%20Diligence%20(thicker%20line).png "Castle Hall Diligence - Logo.png")


At December 31, 2017, the LF Woodford Equity Investment Fund had "Level 3" assets of £824 million - 10.04% of year end net assets (£8.2 billion). At December 31, 2018, Woodford had increased Level 3 holdings to £925 million, despite net assets falling by almost 50%. That meant that Level 3 assets at December 31, 2018 represented 19.77% of the Fund's portfolio. Time to look at those financials...
In the final post in our Risk Without Reward series examining the Woodford Equity portfolio, we have reviewed the financial statements for the LF Woodford Equity Investment Fund for December 31, 2018 and December 31, 2017 (documents obtained from the Woodford website).
(If you'd like to learn more about Castle Hall's financial statement review process - we're happy to shamelessly plug our services, and suggest you download our AFS deck here!)
Auditor and Audit Opinion
Let's start with the auditor and audit opinion. Castle Hall's DiligenceHub online app presents the following diligence information:
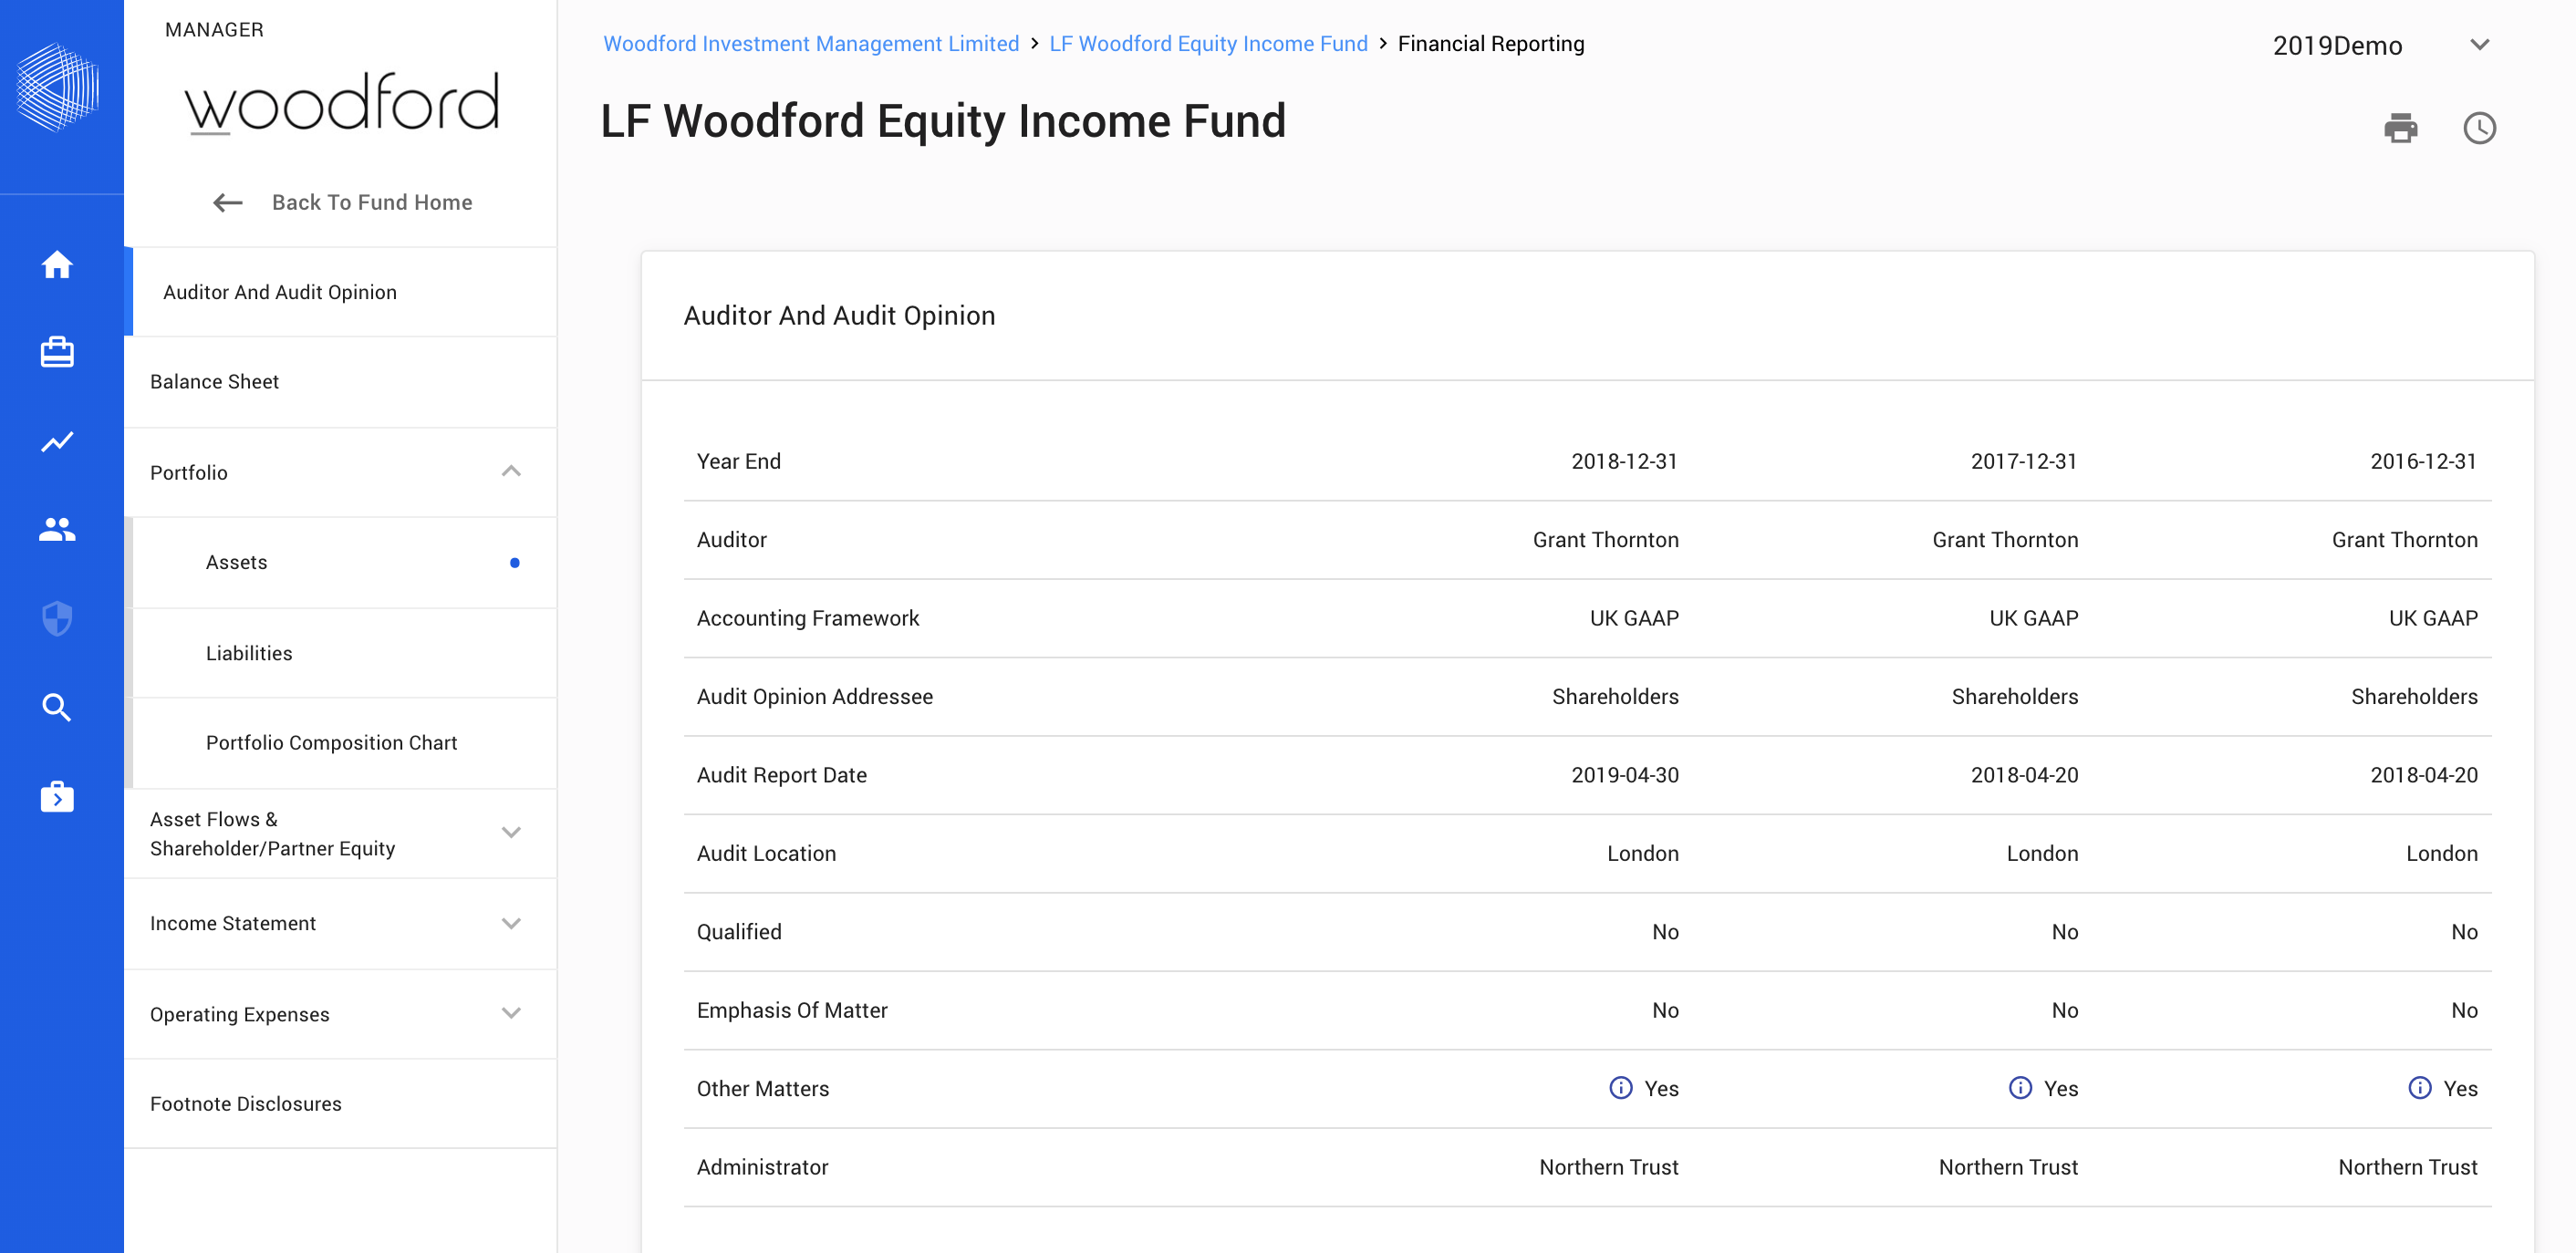
Woodford's auditor is Grant Thornton, the largest global auditor after the Big 4. We have no concerns as to Grant Thornton's ability to audit the Fund, although investors may wish to track which of their portfolio wide investments are not audited by the Big 4.
To help with overall financial statement analysis, Castle Hall reviews 50 analytical factors when completing each financial statement review. Woodford "triggered" the following financial statement analytics:
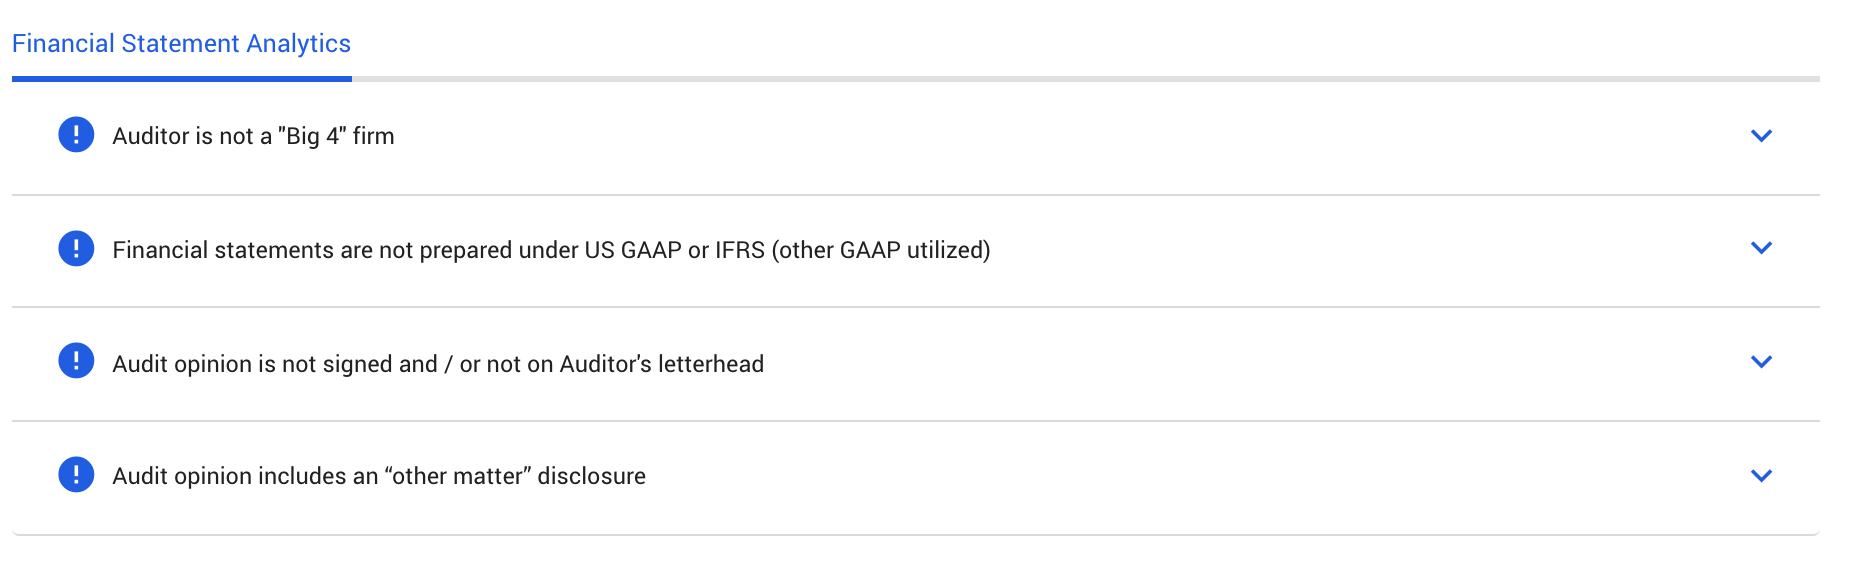
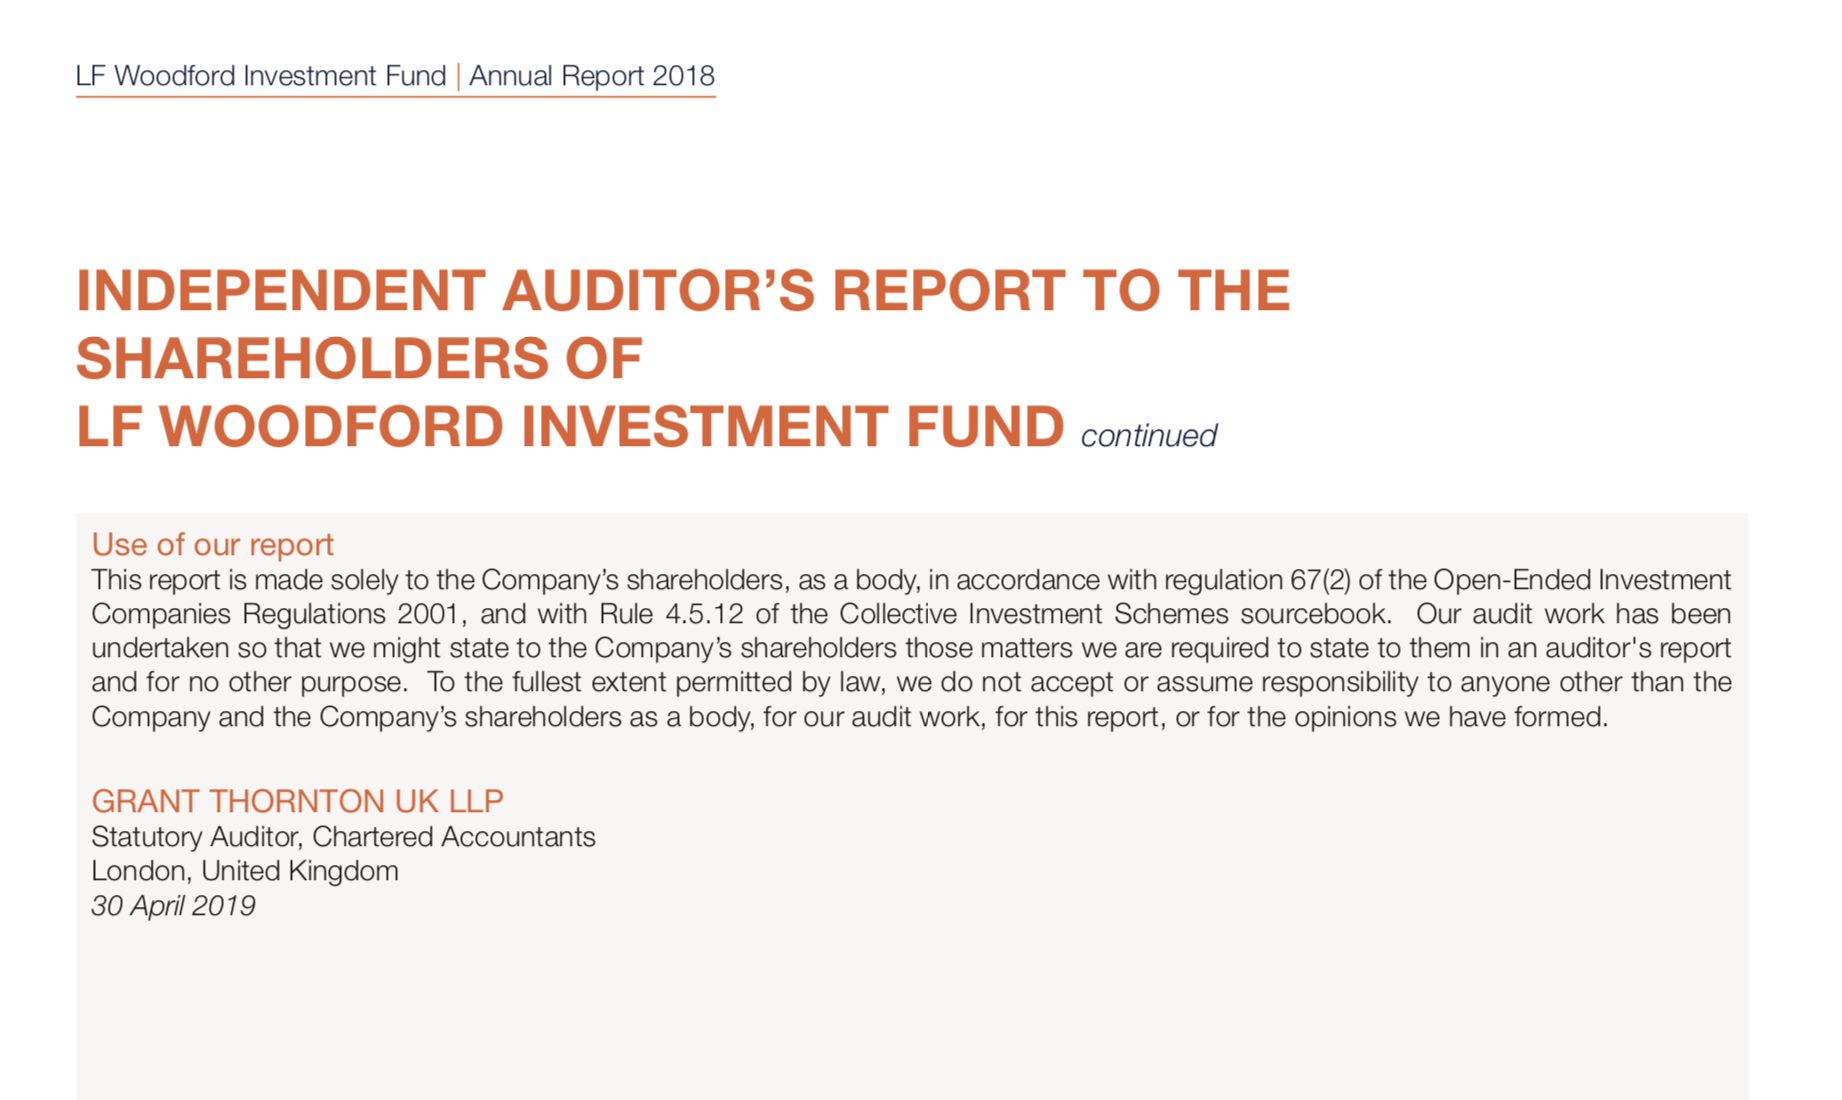
Interestingly, Grant Thornton's audit opinion is part of the "graphic designed" annual report - so technically is not on the auditor's letterhead and is not signed, as below.
There is also an "other matter" disclosure - Grant Thornton have added language to the audit opinion seeking to limit their liability (this is relatively standard language in the UK related to the "Bannerman" decision: nonetheless, it is disheartening to see auditors seeking such restrictive terms with respect to their liability and responsibility to investors - who are the primary users of investment fund financial statements.)
Balance Sheet
OK - next step is to review the balance sheet year on year.
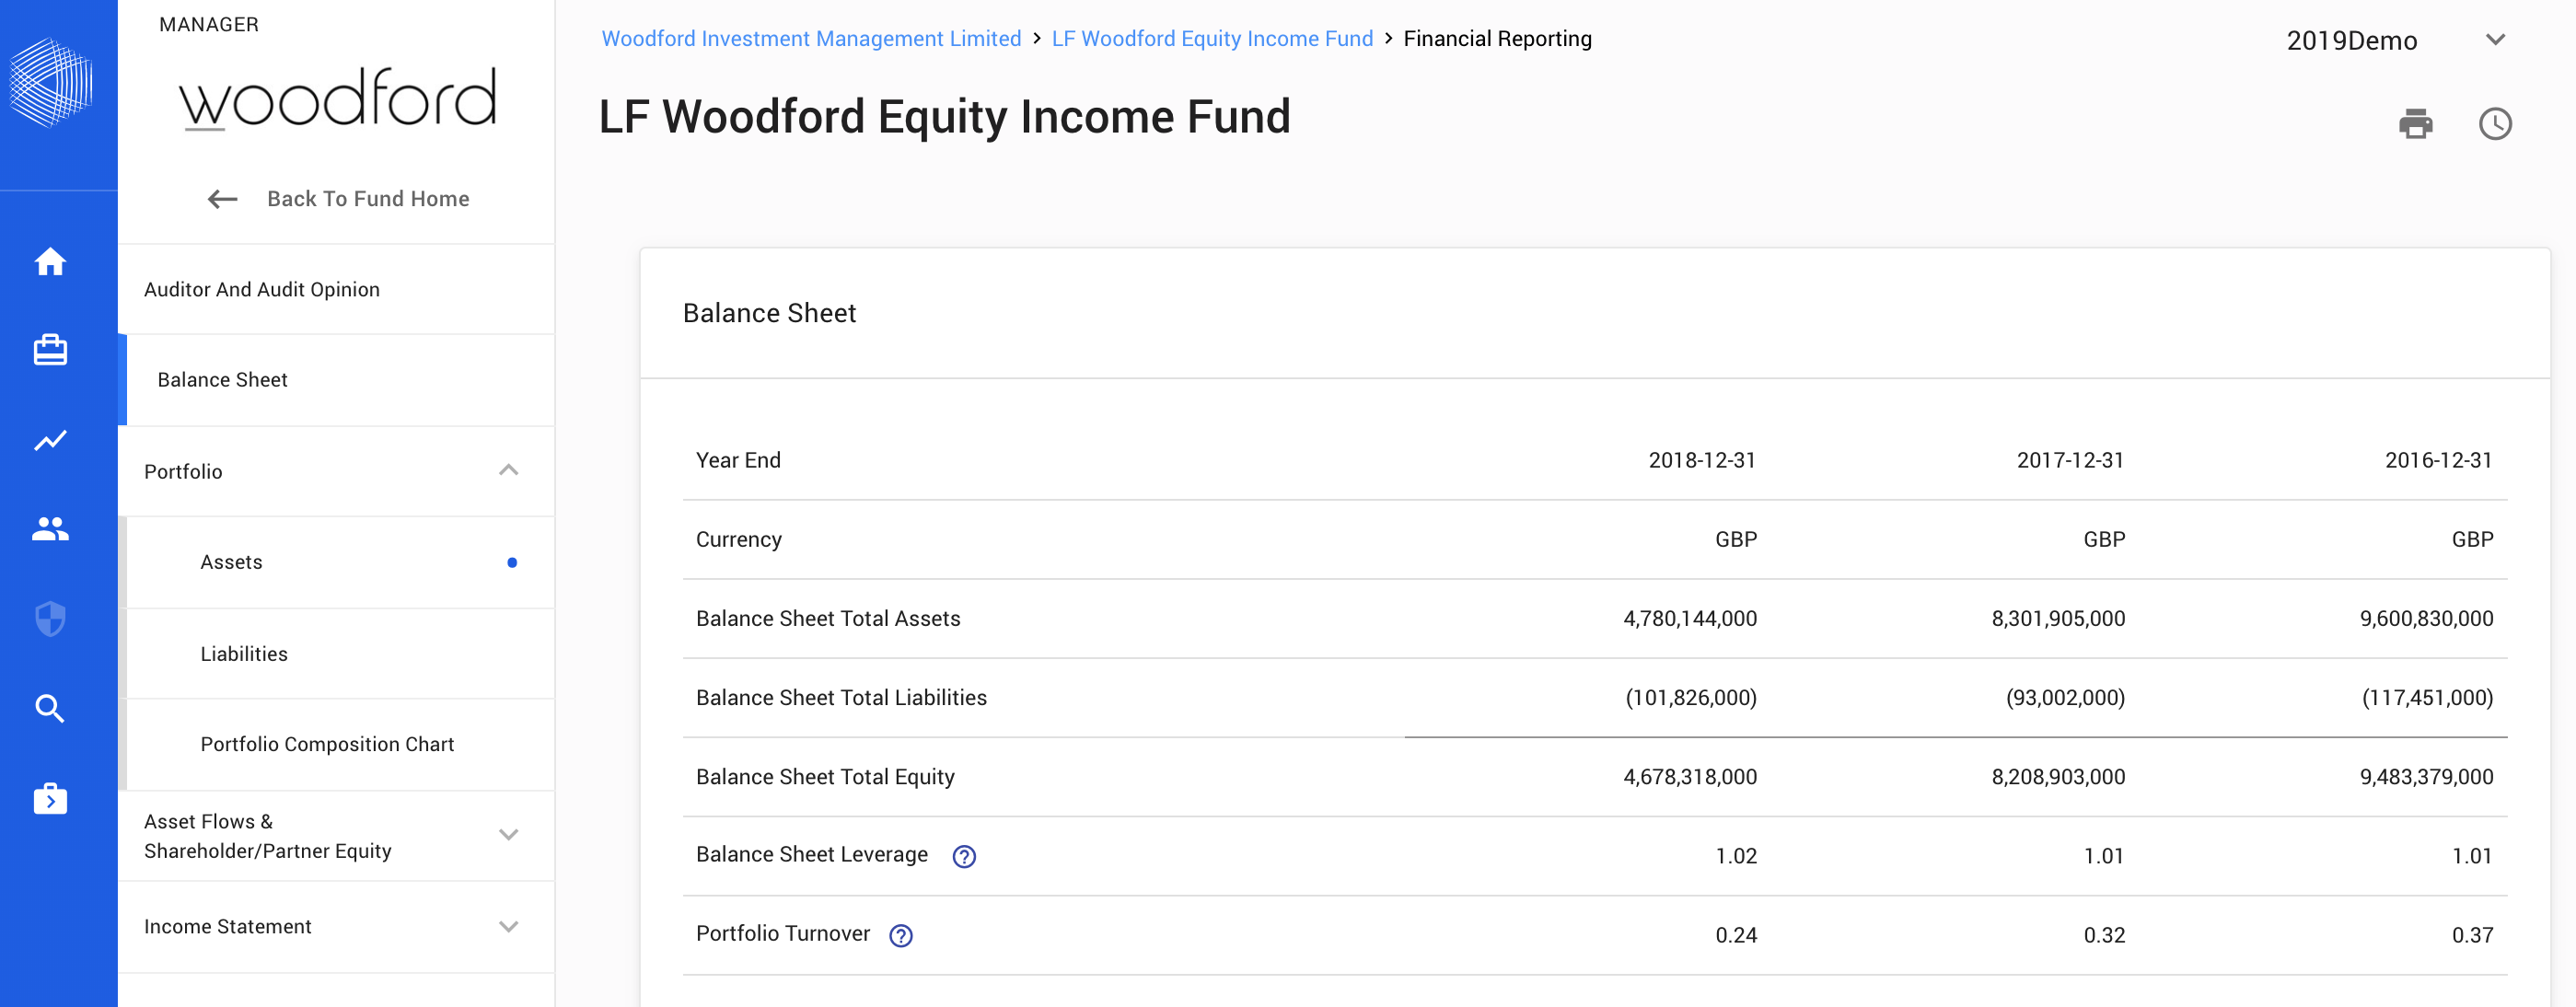
Most important is the decline in net assets - from £9.5 billion at December 31, 2016, down to £8.2 billion a year later, and then a 43% decline to £4.7 billion at December 31, 2018.
Also notable is a decline in portfolio turnover (which Castle Hall calculates as purchases of securities per the cash flow statement, divided by average net assets). The fund is clearly buy and hold (a ratio of 1 implies that the manager "turns over" the portfolio on average once over the financial year.) Here, the fund has dropped from 37% of the portfolio "purchased" each year to 24%.
Portfolio - Level 1 2 3
Now to the most interesting graphics. The Fund's portfolio as a whole looks like this year on year:
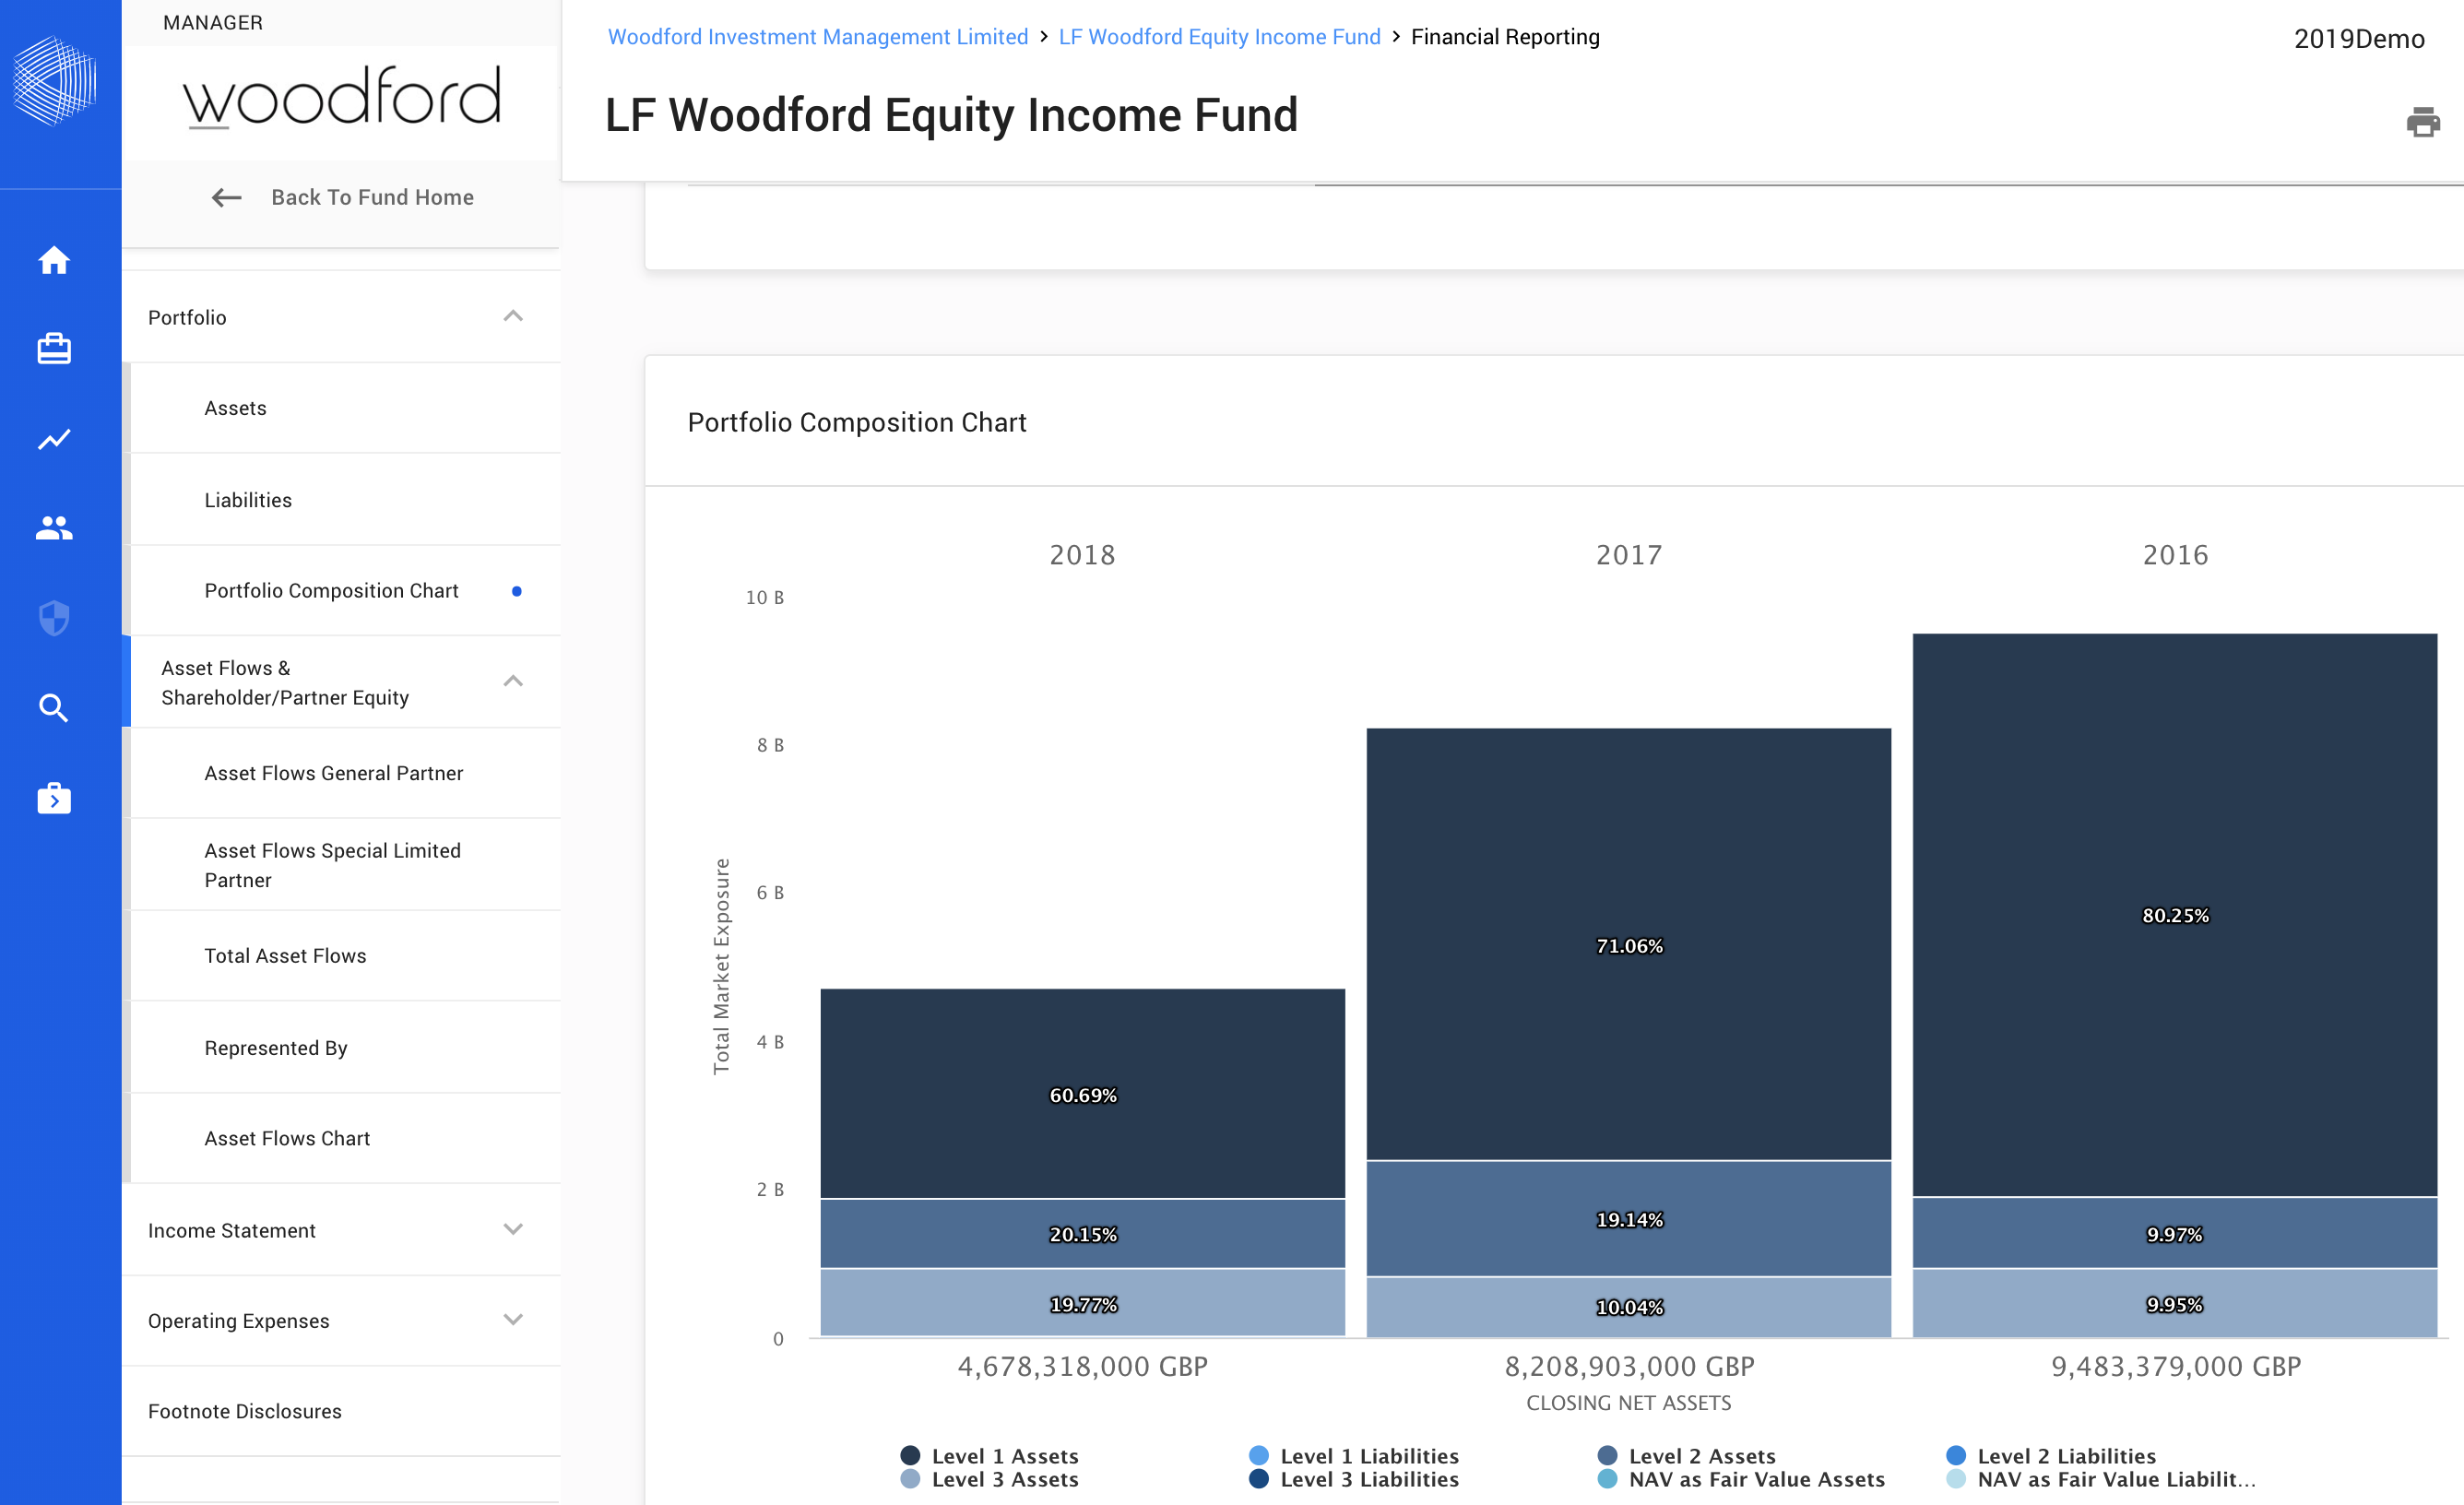
The largest element in the chart represents Level 1 assets, which have fallen from 80% of the portfolio back in 2016, to 61% in 2018.
DiligenceHub allows us to exclude Level 1 and 2 assets from the charting, to show trends in only Level 3 assets:
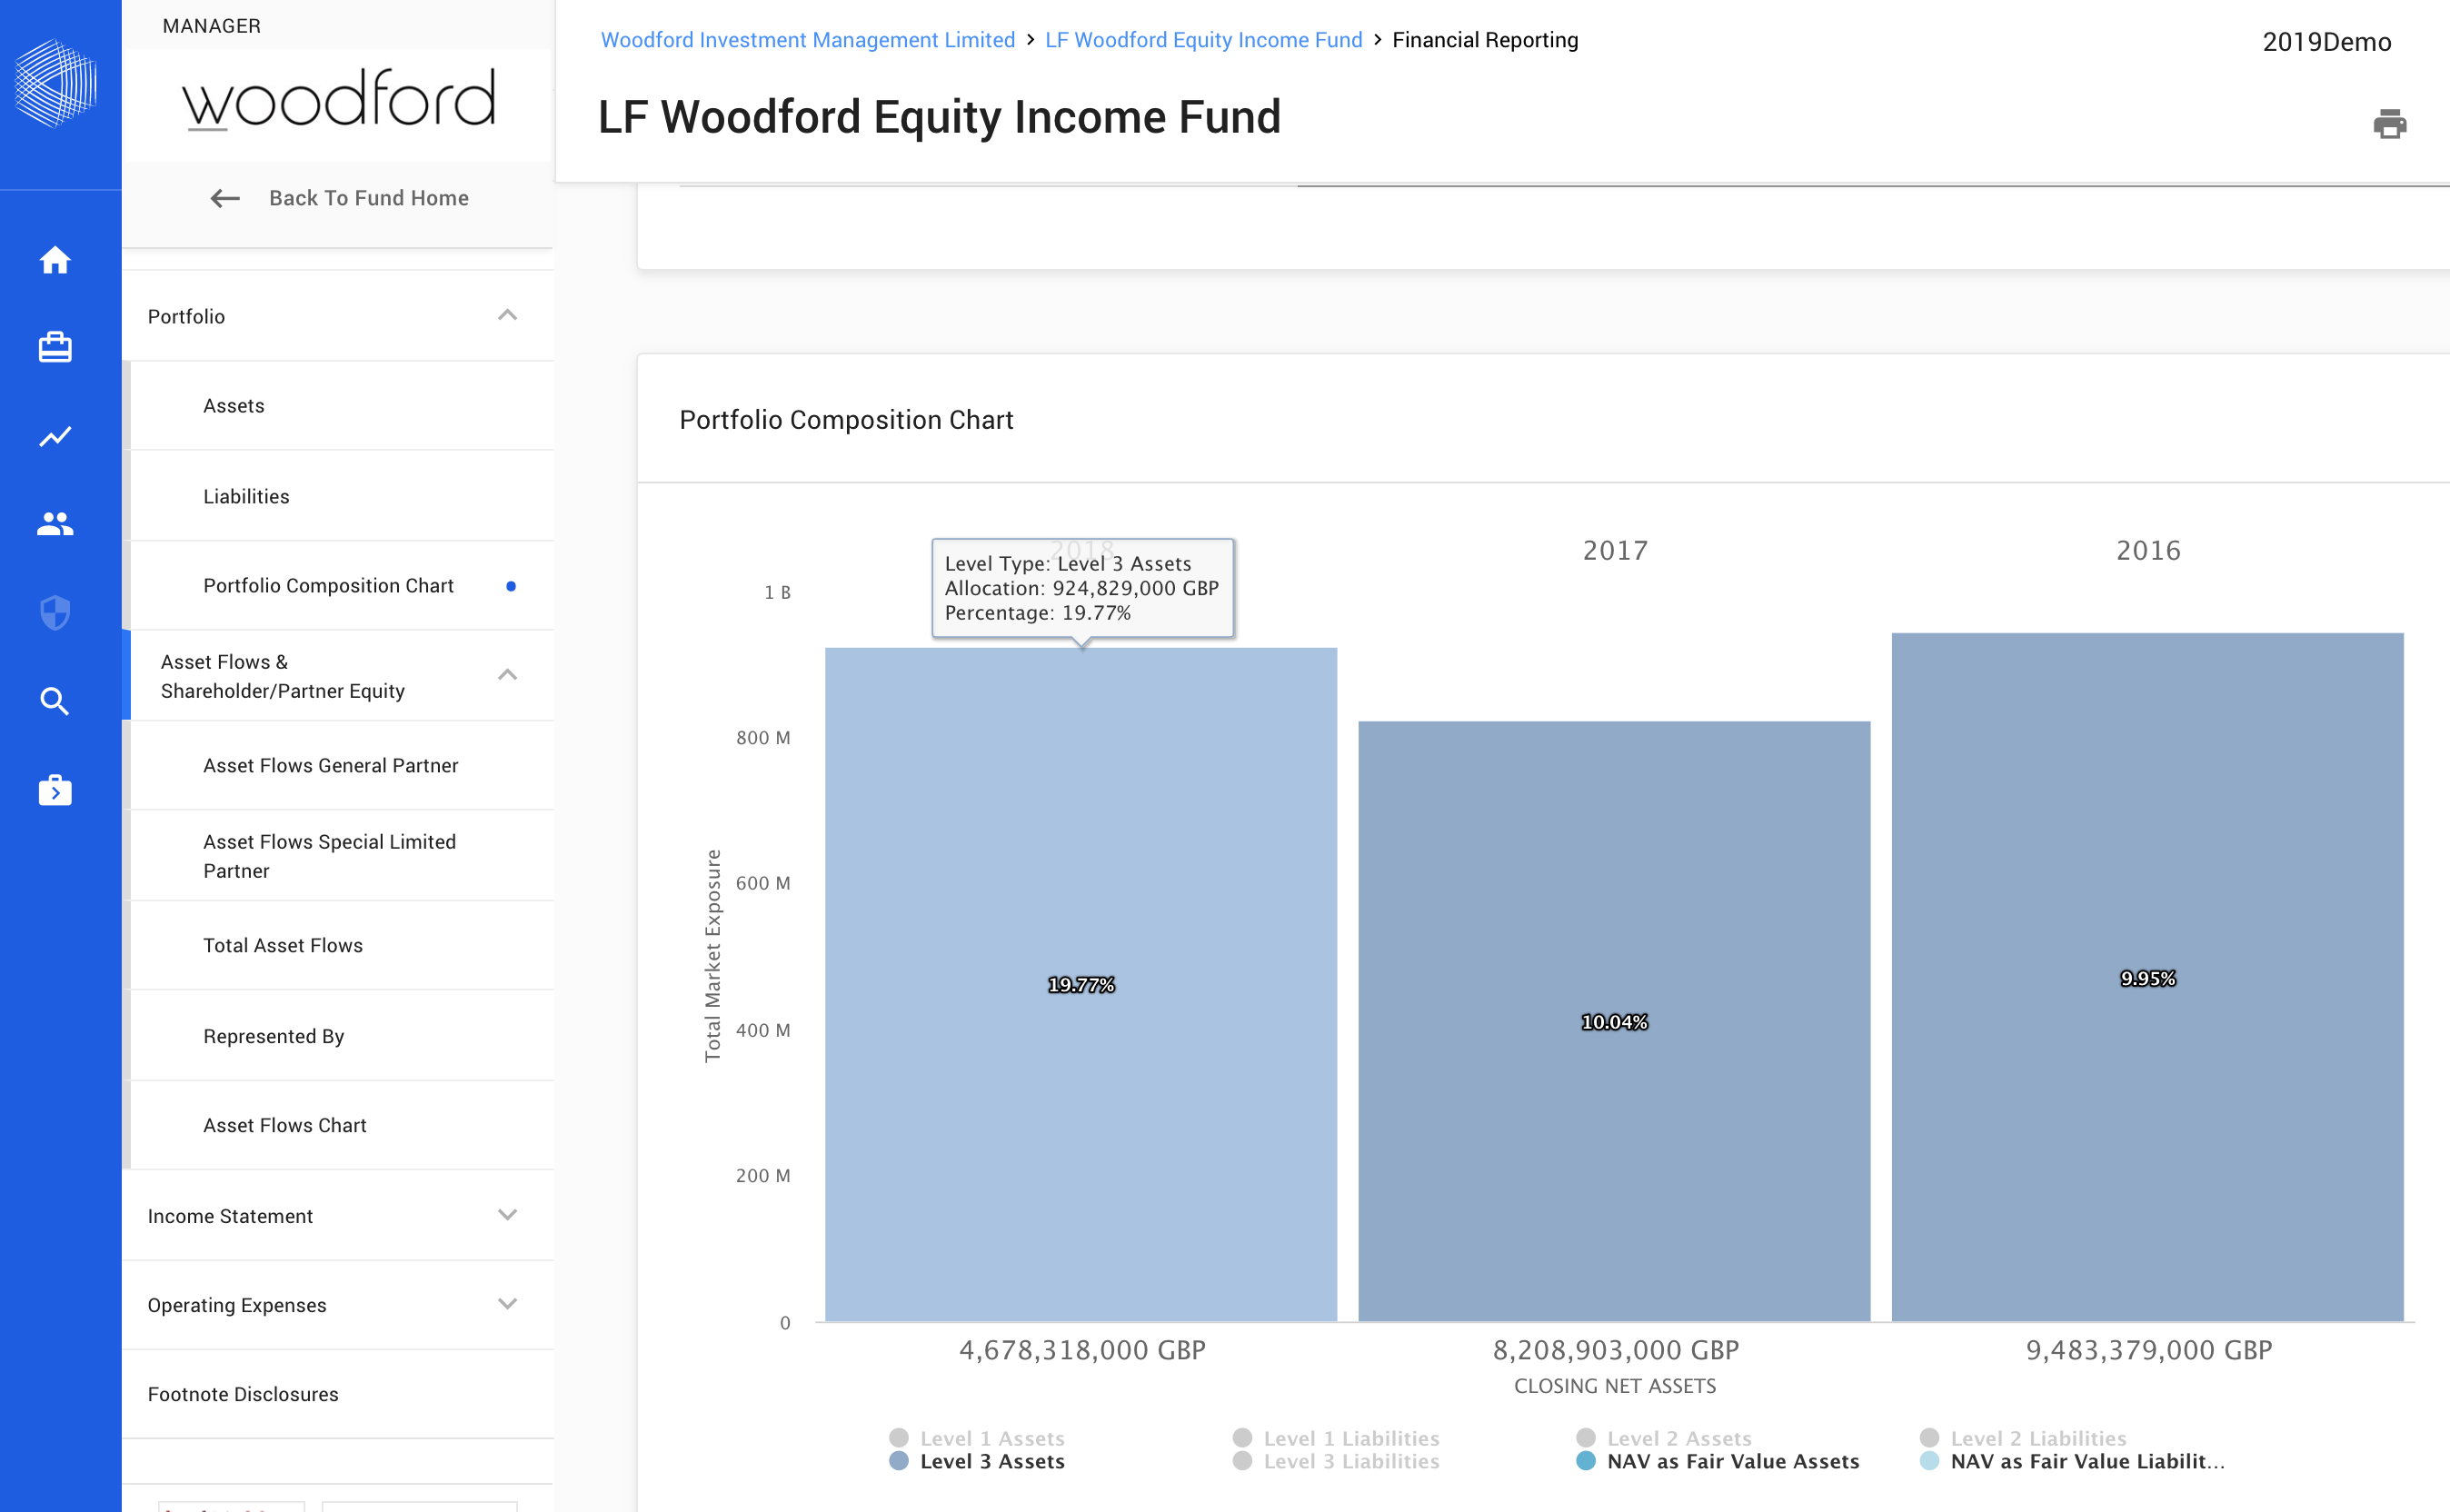
This is where we see the increase in Level 3 investments over 2018 - despite the fall in overall Fund AUM. As such, Level 3 assets represented 20% of the portfolio as of December 31, 2018 - in what is, of course, a daily liquidity fund.
Gains and Losses
One of the key data points in a set of financial statements is how much of a Fund's reported gain or loss is realized (sales in the market generating realized profits or losses) versus unrealized - paper profits booked when existing investments are revalued.
Unrealized gains are generally not an issue when a Fund only holds Level 1 assets, but become much more of a due diligence concern when a Fund has Level 3 assets, which are hard to price and likely illiquid. If a fund reports high unrealized gains on Level 3 assets, are these prices actually reliable - or is the NAV being supported by optimistic "on paper" prices for illiquid positions?
Unfortunately, for the Fund, we don't know - Woodford reports £1.2 billion of "net capital losses", but UK GAAP does not require a break out of realized versus unrealized. As such, financial reporting in the UK is weak in this key area - could it be that the Fund actually "lost" more than £1.2 billion on Level 1 assets (realized and unrealized) but then wrote up Level 3 assets to partially compensate? We do not know and cannot tell from the financial statements.
Further, UK GAAP does not require the schedule of investments to list the cost of investments alongside current "value", so it is not possible to identify any securities which have been significantly written up due to "on paper" revaluations.
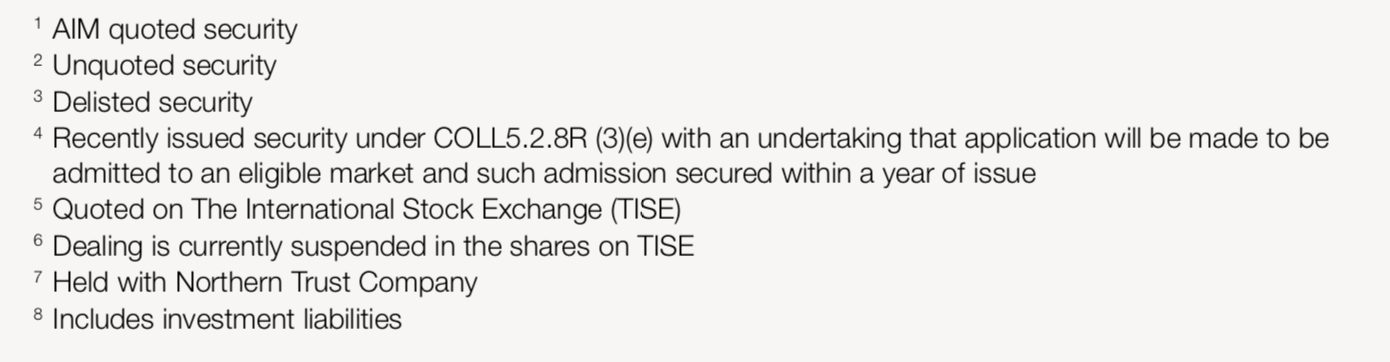
Here, for example, we do not know the cost basis for Industrial Heat (one of the infamous securities "listed" on the TISE, The International Stock Exchange). In this area, UK GAAP falls short of the disclosures standards in the US. (To be clear, this is not a criticism of Woodford, rather a critique of UK investment company reporting formats).
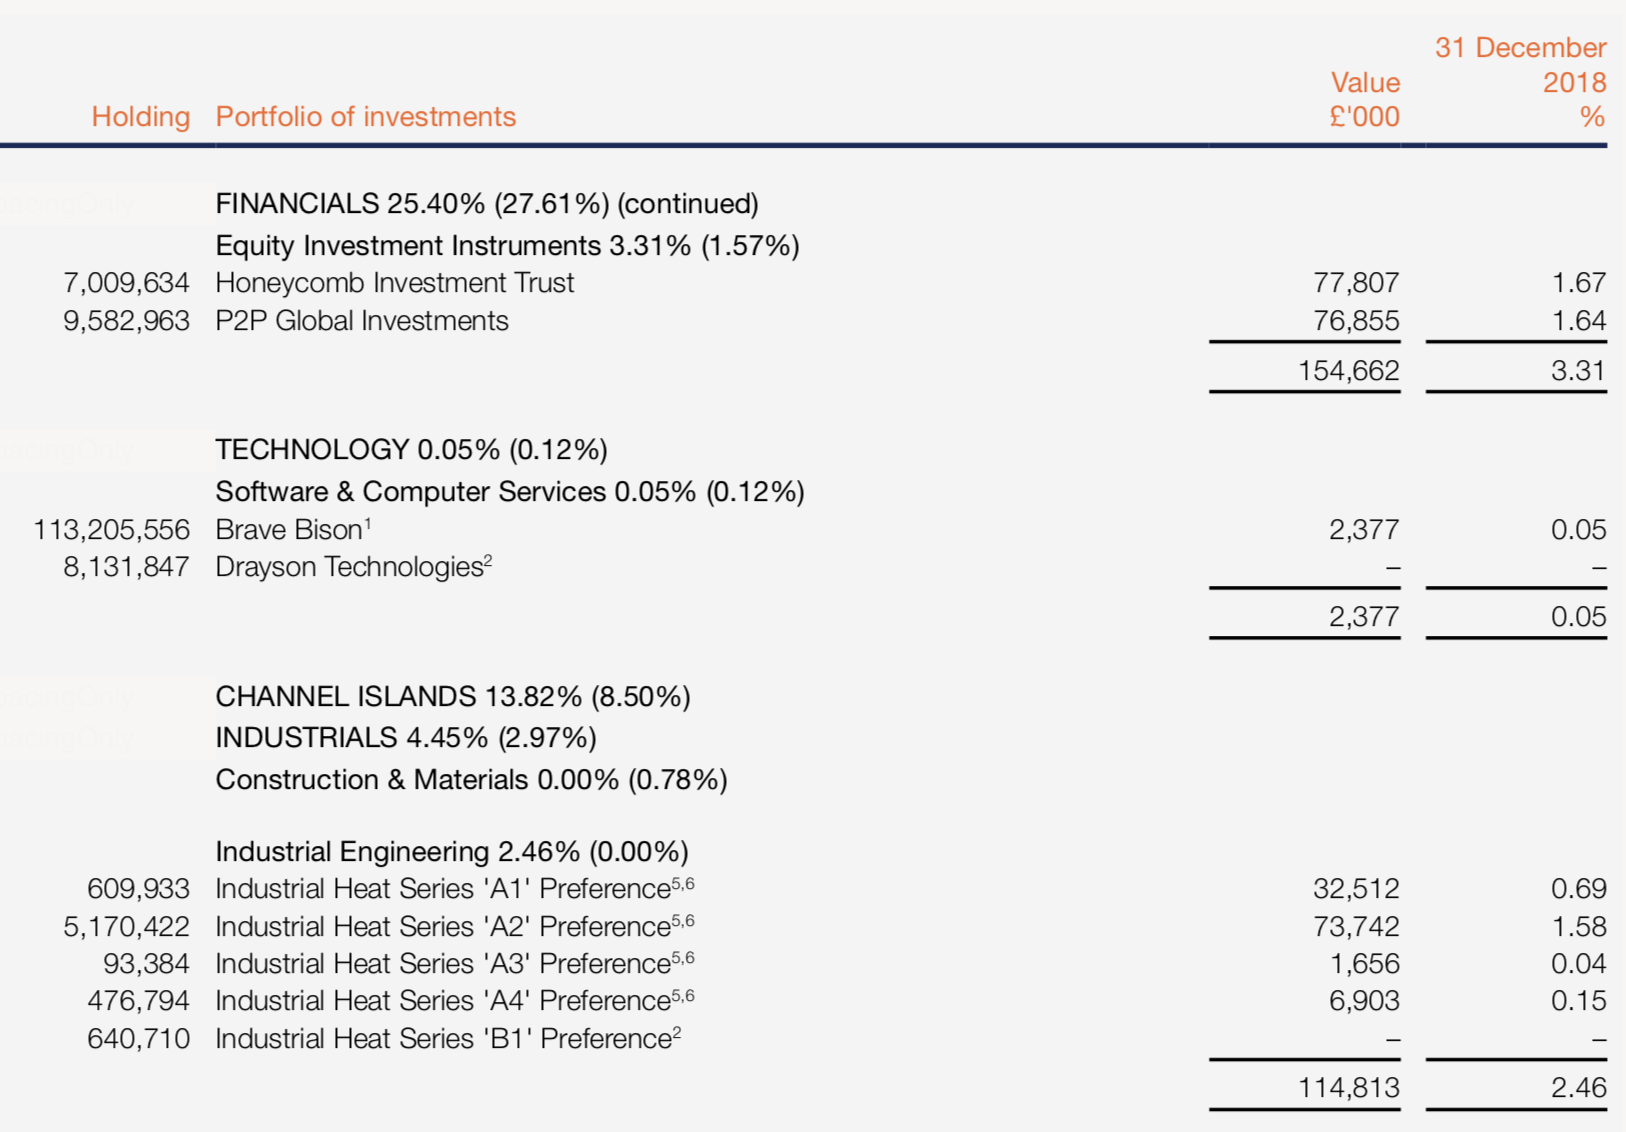
As a final point, the schedule of investments does add notes ("5" and "6" above). These reflect a range of illiquidity variants in the portfolio - which are unhelpfully not summed / totalled in the footnotes.
Fees and Expenses
Again, not too much to go on here. The only expenses noted in the accounts are administrator fees at £85,000 (there is also a further £1,000 of legal fees).
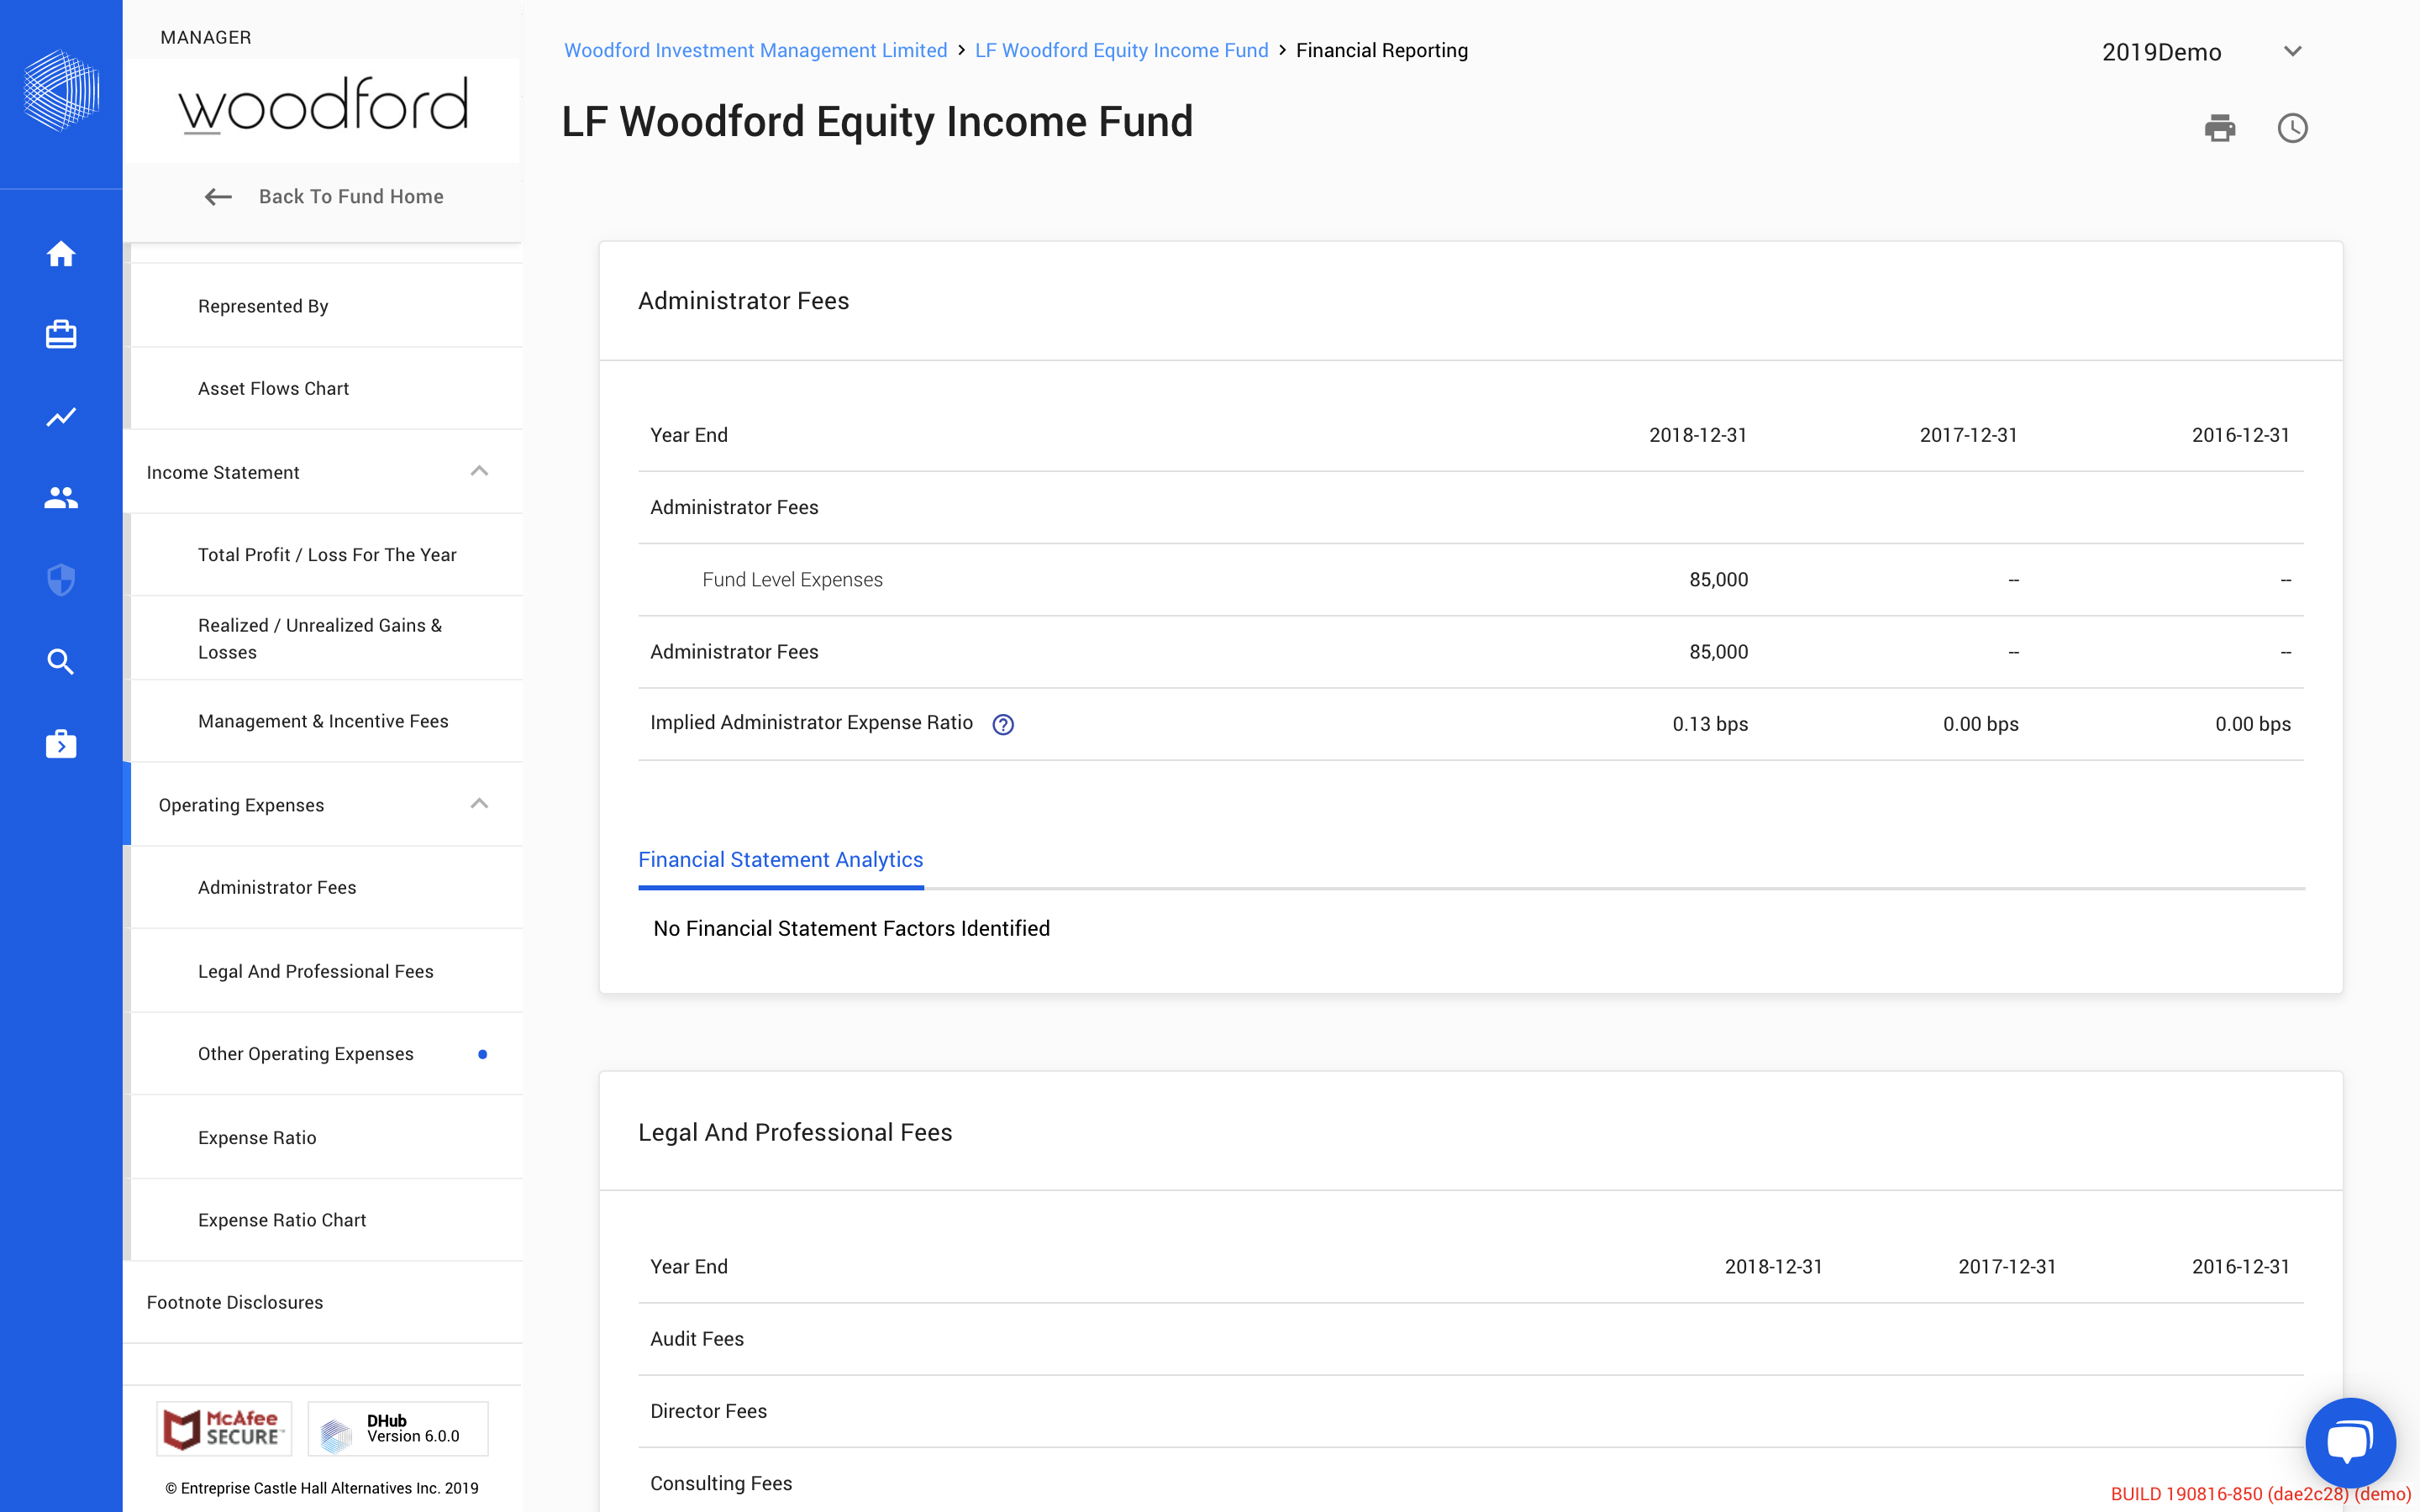
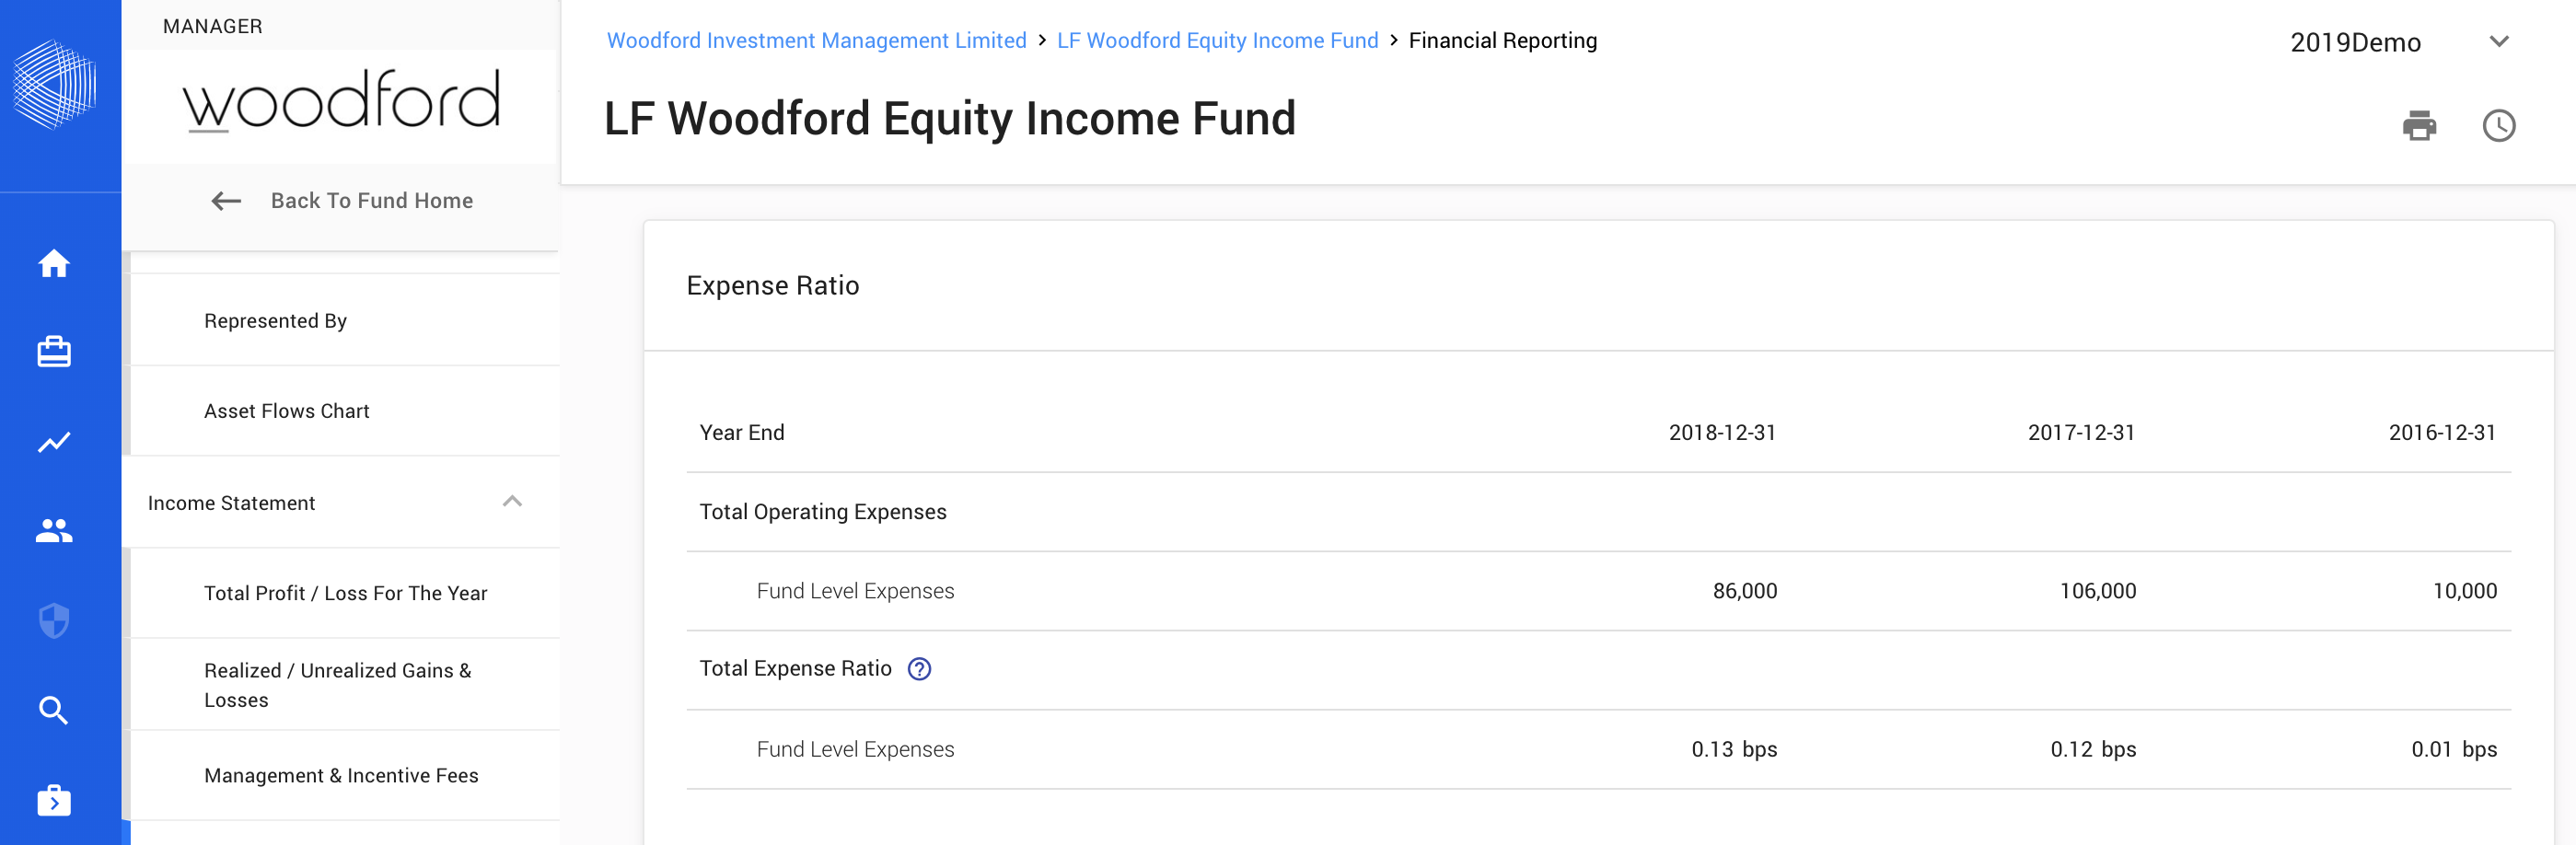
This results in the Fund having one of the lowest expense ratios we have ever seen - at a mere 0.13 basis points!
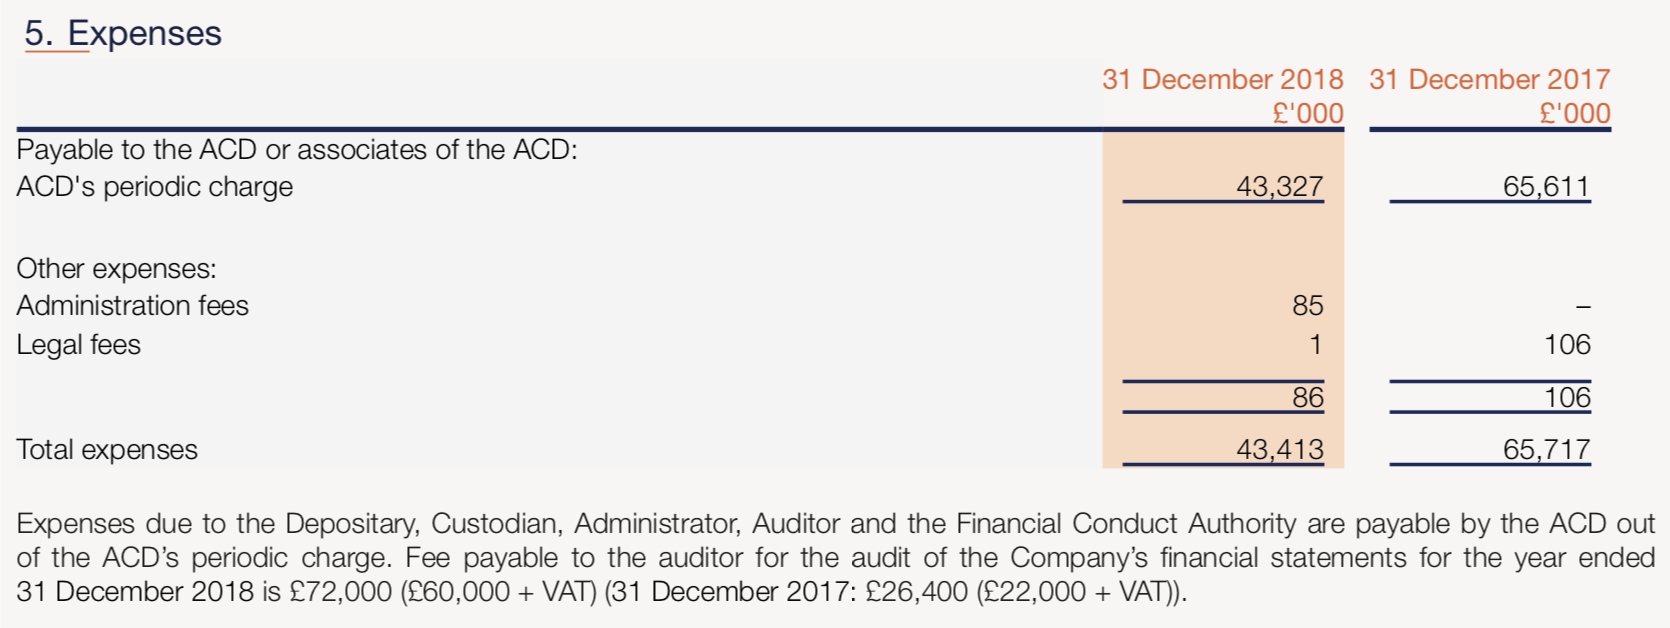
But hang on a minute - where are the rest of the fees? One characteristic of UK funds is that all other fees - including the management fee paid to Woodford - are combined in a single payment to the Authorised Corporate Director, Link Fund Services. From this amount, Link then pays other providers - as noted in the accounts:
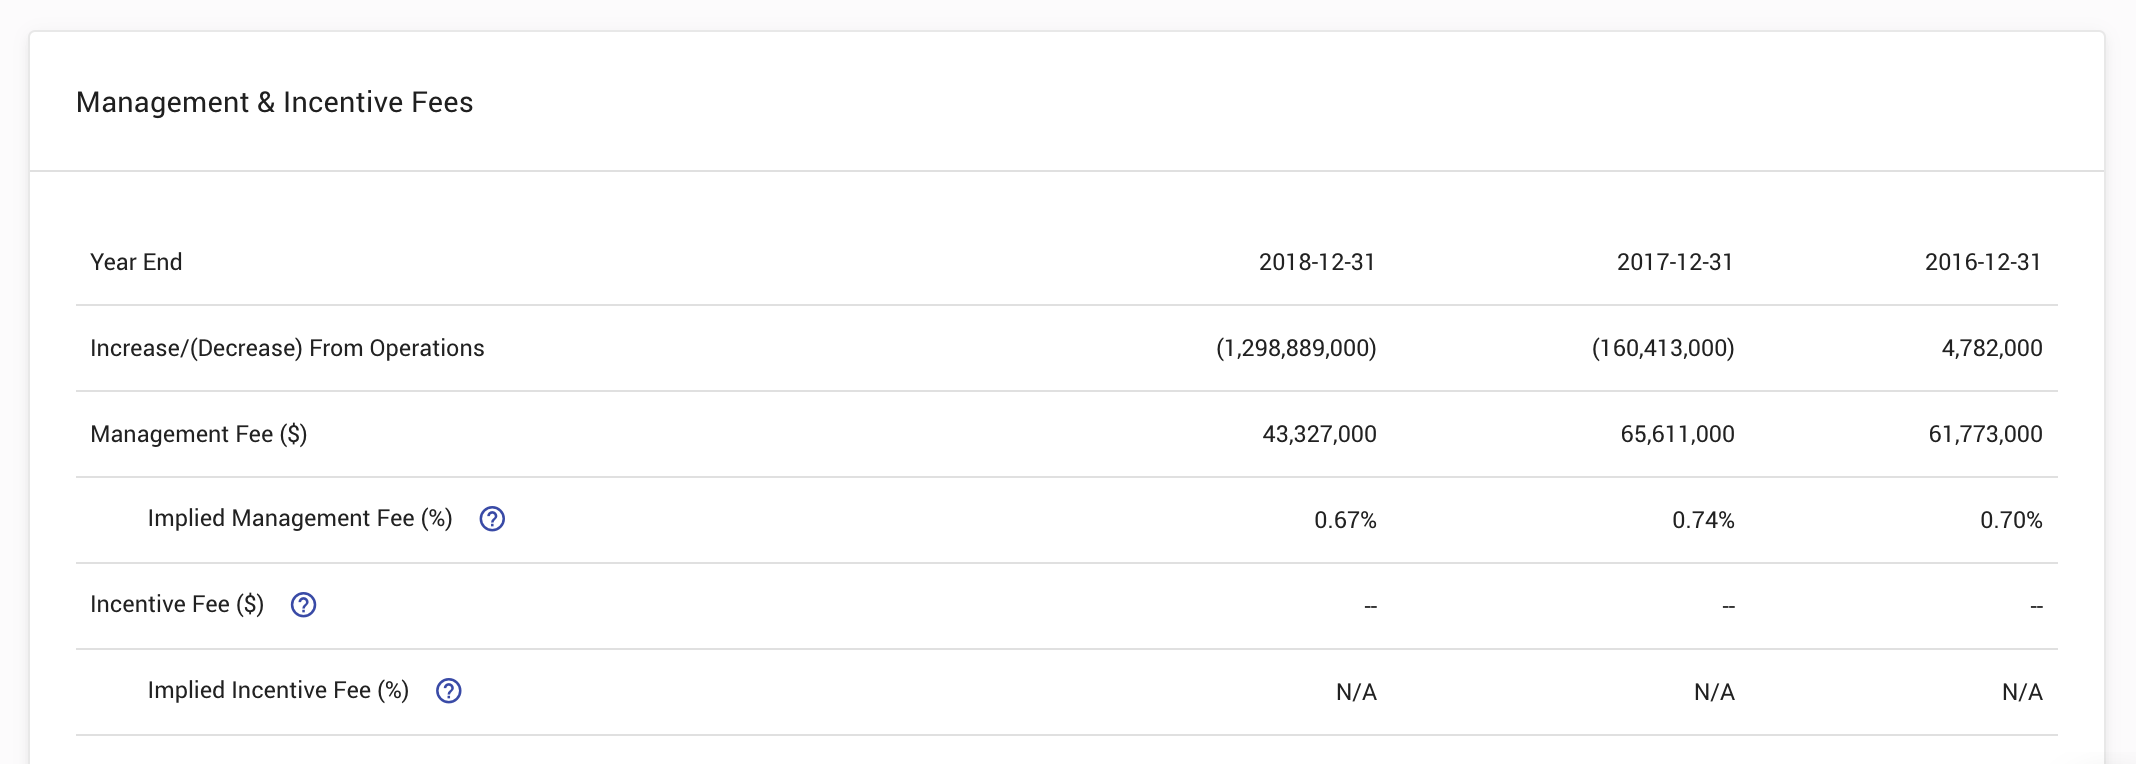
Actual disclosure of expenses incurred is limited, therefore - although the financial statements do allow analysis of the average "management fee" (in fact being the amount paid to Link, of which a portion (presumably the significant majority) is paid to Woodford). Ratios, as below, do appear relatively consistent.
Footnote Disclosures
Finally, do the footnotes contain any other information? Castle Hall focuses in on three areas: related parties, commitments and contigencies, and subsequent events - these are the "key" notes where issues impacting due diligence are most likely to be found.
And yes, the Fund has a very material subsequent disclosure:
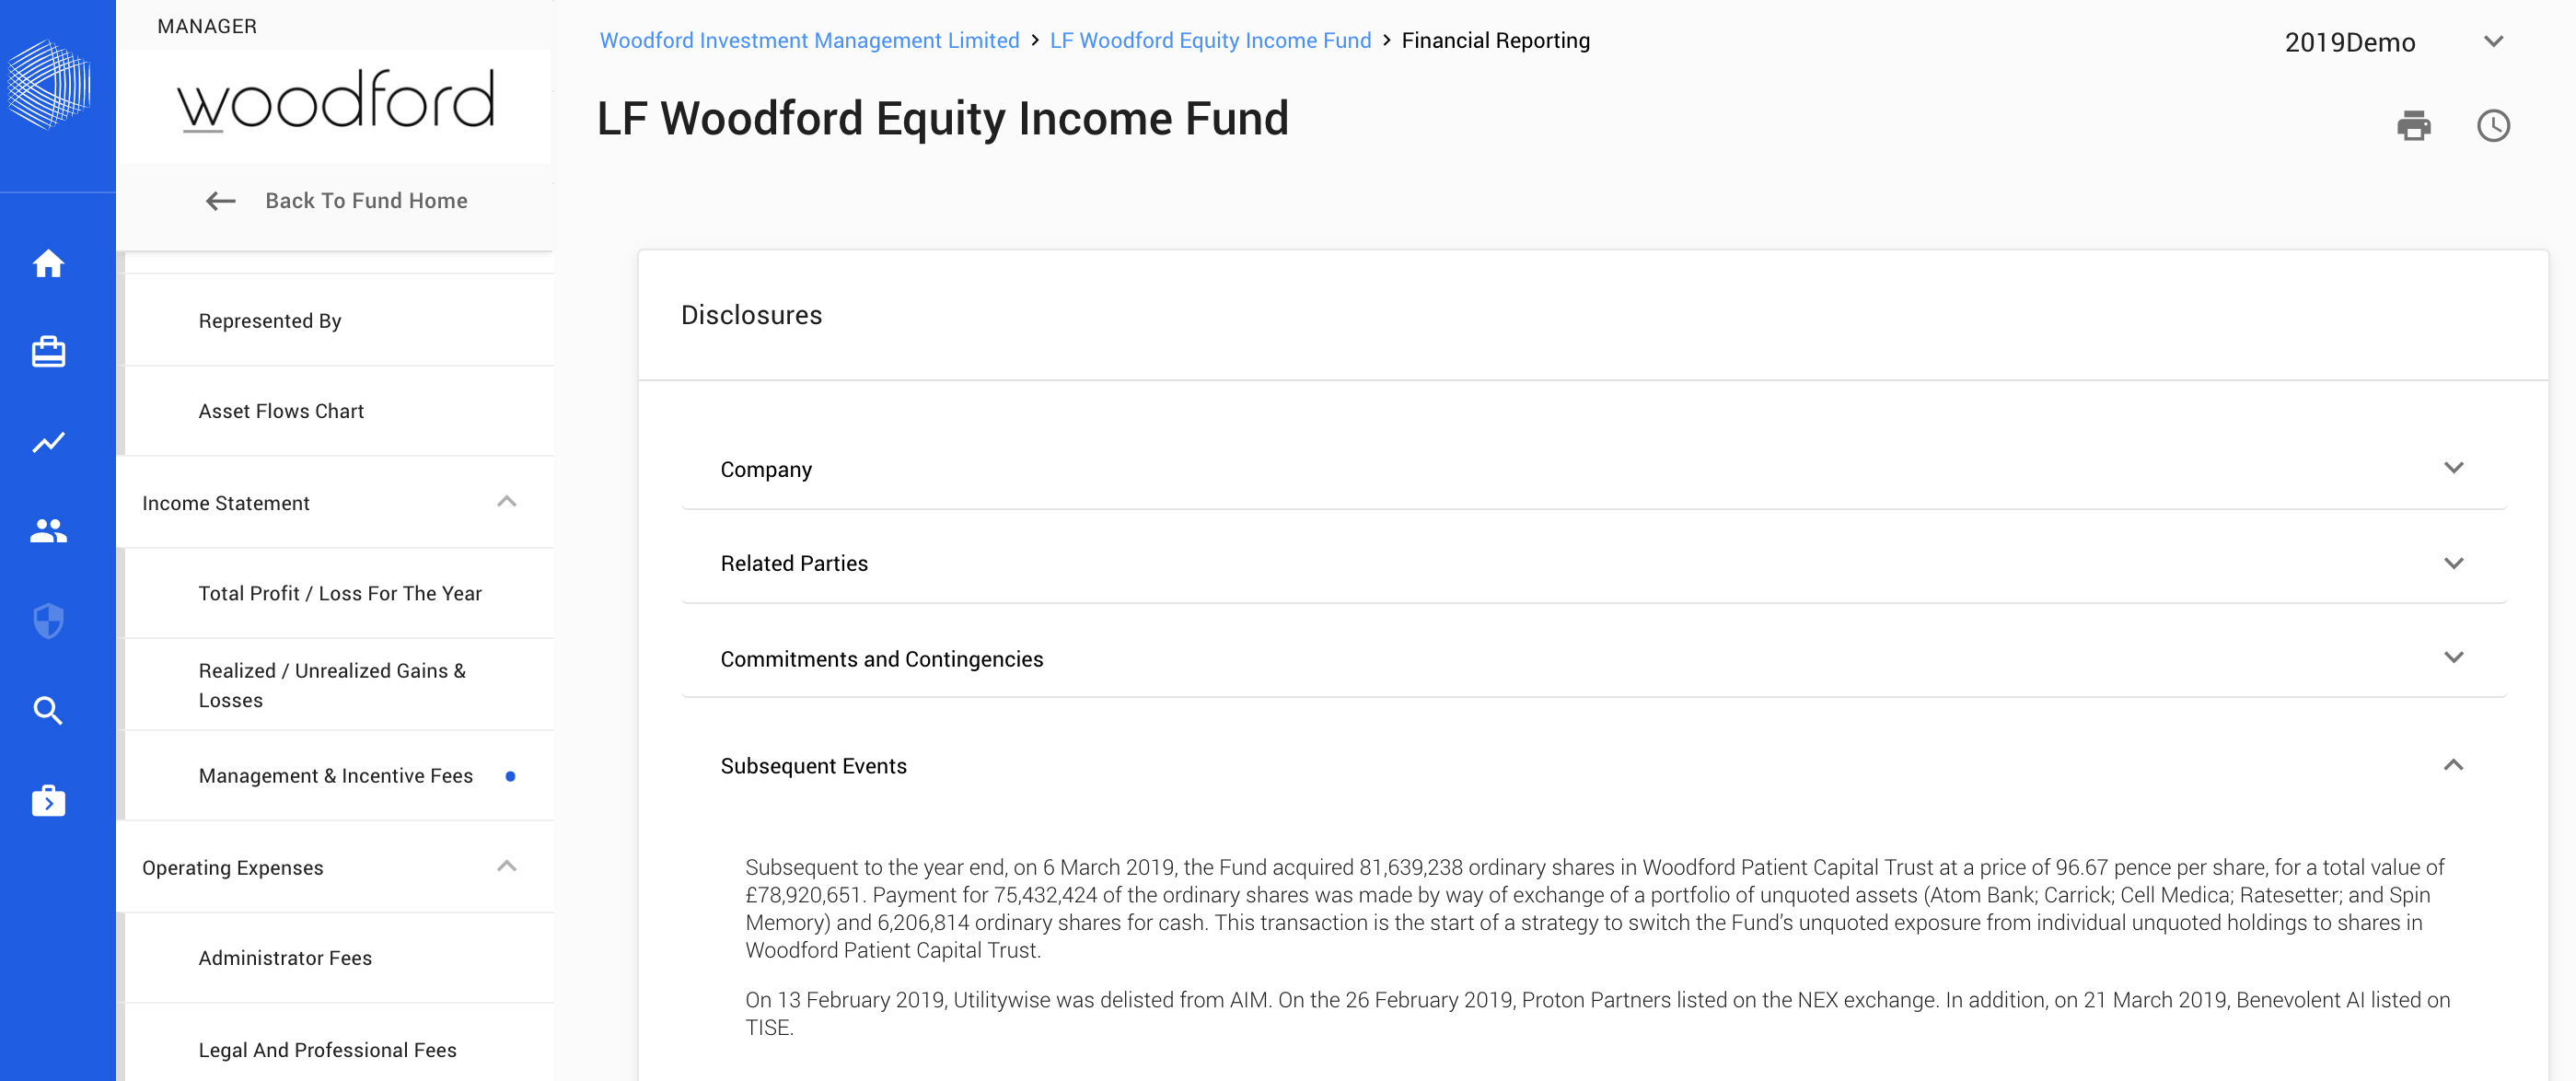
So, as discussed in our last blog, the Fund entered into a transfer of assets between related parties, transferring £75 million of assets to the Woodford Patient Capital Trust. A review of the subsequent event notes is, therefore, very revealing.
So, what are the lessons learned?
And finally - the biggest lesson from Woodford? Consistent diligence is required for every asset manager, including, as we see with the Woodford case, in long only portfolios.
